Energy production – mainly the burning of fossil fuels – accounts for around three-quarters of global greenhouse gas emissions. Not only is energy production the largest driver of climate change, the burning of fossil fuels and biomass also comes at a large cost to human health: at least five million deaths are attributed to air pollution each year.
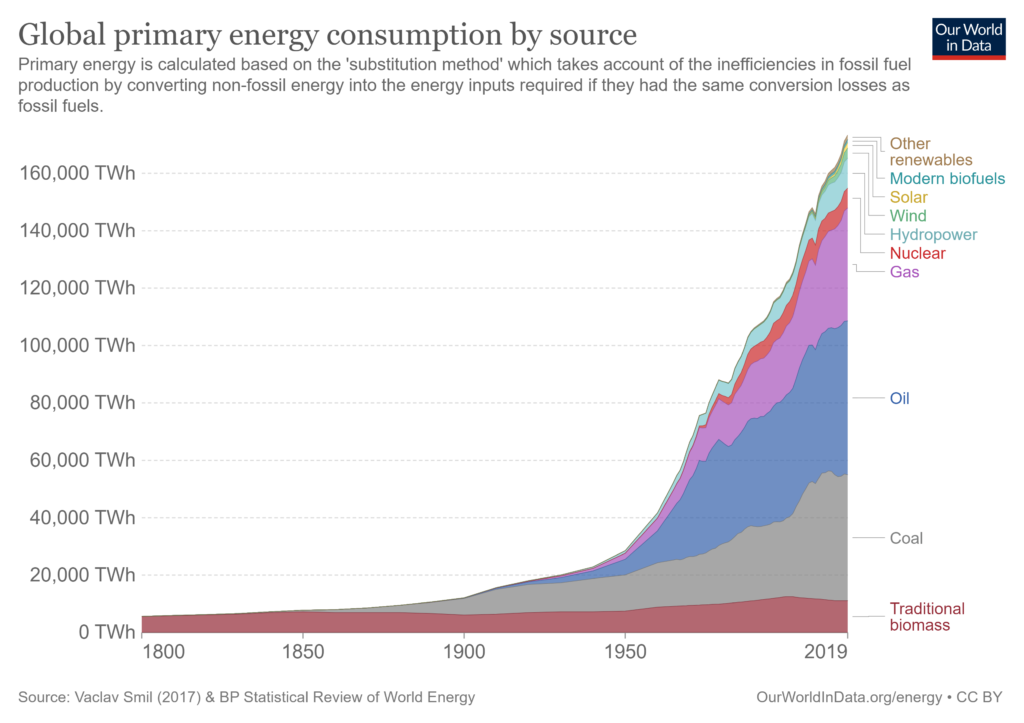
The world therefore is shifting away from fossil fuels to an energy mix dominated by low-carbon sources of energy – renewable technologies and nuclear power1. What does our energy mix look like today?
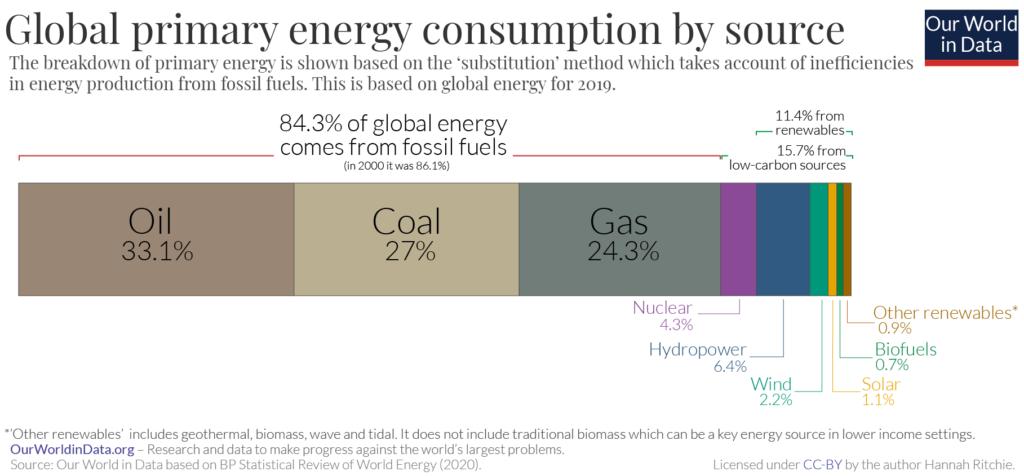
In 2019, almost 16% (15.7% to be precise) of global primary energy came from low-carbon sources. Low-carbon sources are the sum of nuclear energy and renewables – which includes hydropower, wind, solar, bioenergy, geothermal and wave and tidal. 11.4% came from renewables; and 4.3% came from nuclear. Hydropower and nuclear account for most of our low-carbon energy: combined they account for 10.7%. Wind produces just 2.2%, and solar 1.1% – but both sources are growing quickly.
Country Differences in Electricity Generation Related Emissions
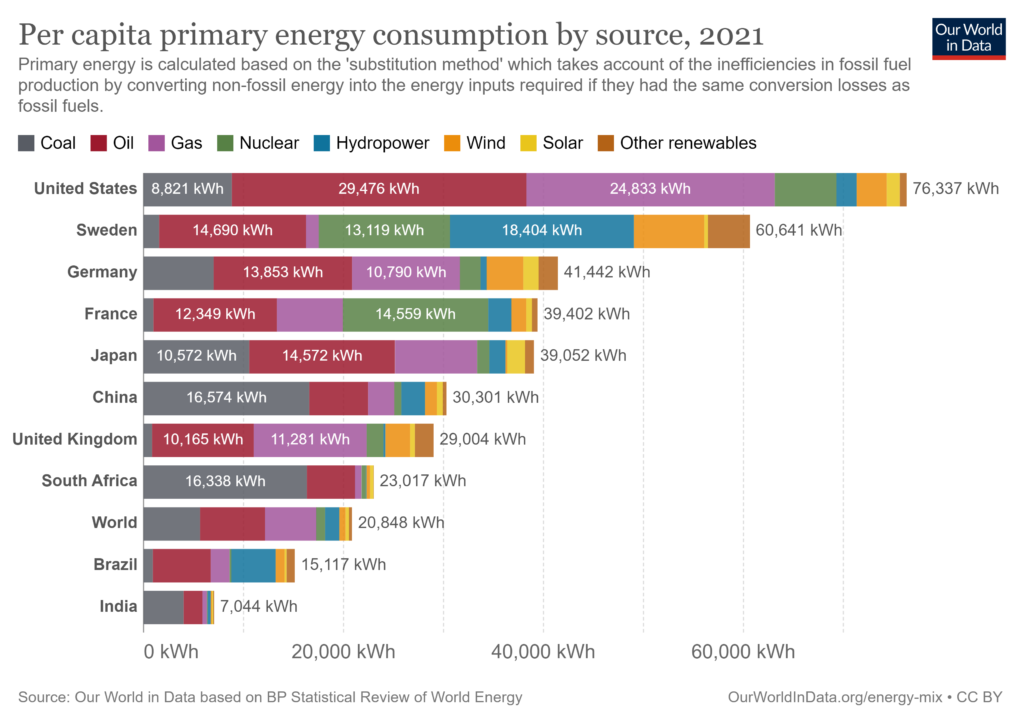
Each country has access to various resources at its disposal to generate electricity and power its economy. If we look at a kilowatt-hour of energy for various countries we can estimate the carbon footprint based on thir energy mix. We will look at this in the next blog.
- Hannah Ritchie, Max Roser and Pablo Rosado (2020) – “Energy”. Published online at OurWorldInData.org. Retrieved from: ‘https://ourworldindata.org/energy’ [↩]